3.3. Fplots
MATLAB includes another 2-D plotting function that comes in handy when
working with either function handles, anonymous functions, or symbolic
math functions (Function Handles, Symbolic Differential Equations). The plot,
annotations, and options are the same as the plot function. However,
instead of passing vectors for the \(x\) and \(y\) data, we give
fplot a function and a range of values for the \(x\) axis. The
default \(x\) axis range is \(-\)5 to 5.
In addition to being convenient when working with function handles or
symbolic math functions, fplot also correctly handles plotting
difficulties, such as data discontinuities. A good example of this comes
from the trigonometric tangent function, shown in figure
Fig. 3.11,
>> fplot(@(x) tan(x), [0 2*pi])
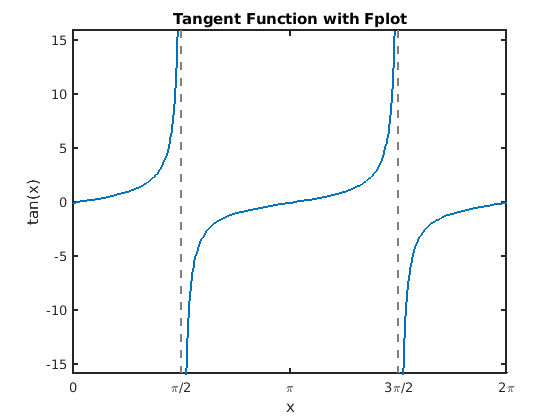
Fig. 3.11 The fplot function handles the data discontinuities of the tangent
function.
Note
Now work on The Flight of a Home Run Baseball.
