3.1. Using the Plot Tool
This video demonstrates how to use the Plot Tool.
The Plot Tool is convenient when you don’t know what type of plot that you want or are not sure how to create the plot that you want. Click on the plot tab to browse through a list of plot types. As shown in Fig. 3.1, when you select the variables that you want to plot from the Workspace, the plot types suitable for the data will be available to select. Click on a plot type, and the plot will be created. As shown in Fig. 3.2, the pull–down menus are used to add annotations such as a title and labels for the \(x\)– and \(y\)–axes. Note that the annotation tools are also available to plots created from the Command Window, scripts, or functions.
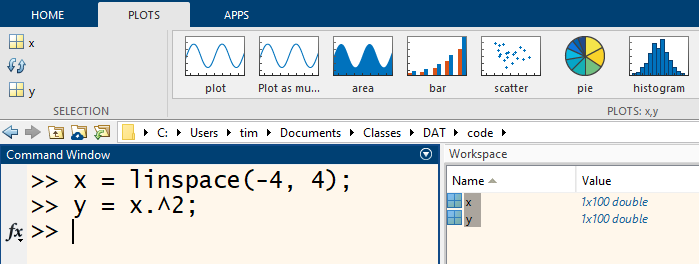
Fig. 3.1 The Plot Tool lets user select the data and plot type with a click of the mouse.
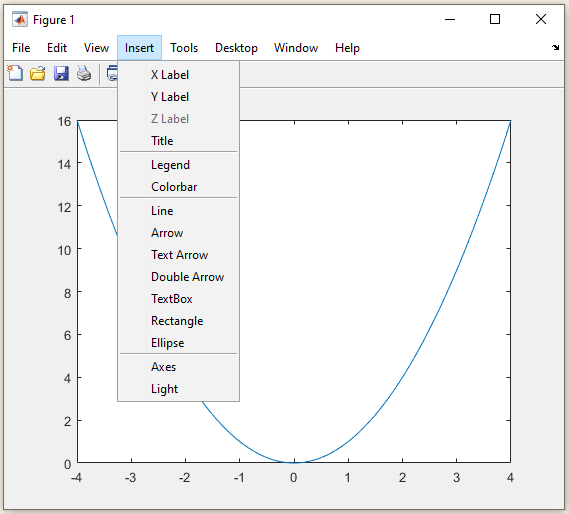
Fig. 3.2 The Plot Tool pull down menus provide a graphical interface to annotate a plot.
One factor that discourages using the Plot Tool is that plots are created manually with the graphical interface, whereas plotting commands entered in a script or function are easy to fine-tune with editing and can be re-run as desired. However, the Plot Tool can create code for a script or function to preserve the steps to make a plot with the Plot Tool.
