3.1. Interactive Plot Editing
Plots in MATLAB are usually created and enhanced with features such as a title, axis labels, and legends from commands in a script. However, MATLAB has two tools to interactively create and edit plots. First, if you don’t know what type of plot you need or how to create it, click on the plot tab to browse through a list of plot types. Select the row vector for the \(x\) axis data from the Workspace. Next, select the row vector for the \(y\) axis data. Then click on the type of plot desired, and as shown in figure Fig. 3.1, the appropriate plot command will be entered in the Command Window to create the plot.
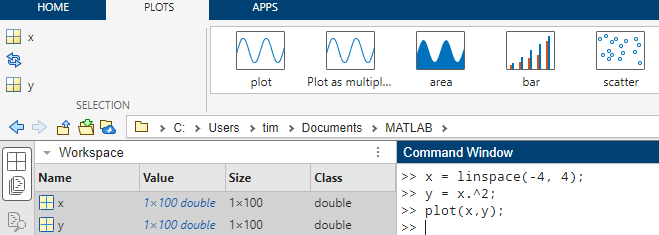
Fig. 3.1 The user can select the data and plot type with a few clicks of the mouse.
The second tool to interactively edit a plot is accessed from the Figure window that displays a plot. The Plot Editor can add features such as a title or axis labels to a plot, but it is also a tool to inspect and edit a plot. The FIGURE tab includes tools to add features to the plot as shown in figure Fig. 3.2.
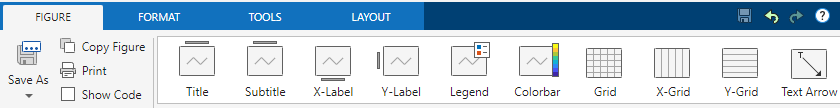
Fig. 3.2 Add plot features to a plot with the Plot Editor.
As shown in figure Fig. 3.3, the Plot Property Inspector is started from selections under the FORMAT tab of the figure window. Click on Select Plot & Edit and then More Properties.
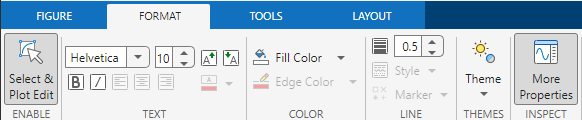
Fig. 3.3 The Plot Propterty Inspector is accessed from the FORMAT tab of the figure window that displays the plot.
A dialog menu box, such as shown in figure Fig. 3.4, is displayed next to the plot. The options in the Plot Property Inspector allow users to edit all of the possible properties of the plot.
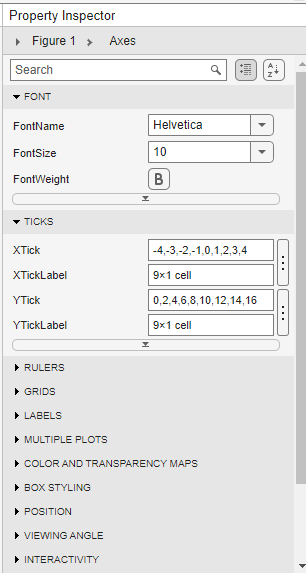
Fig. 3.4 Edit a plot’s properties with the Plot Property Inspector.
Note
The Plot Editor replaced the Plot Tool in version 2025a of MATLAB. The Plot Tool was primarily used to add new features such as titles, labels, or text boxes to a plot.
Interactively editing a plot can be convenient. However, plotting commands entered in a script or function are easy to fine-tune with editing and can be re-run as desired. So it may be desired to see the commands that the Plot Editor used. Click on the Show Code box on the FIGURE tab to view and copy the code for inclusion in a script or function.
