5.2. How SVD Changes Vectors
Except for rotation matrices and eigenvectors, we normally see rotation
and stretching when a vector is multiplied by a matrix. When the matrix
is represented by its SVD factors, we see rotation, stretching, and
again rotation when we multiply a vector sequentially by
\(\mathbf{V}^T\), \(\mathbf{\Sigma}\), and \(\mathbf{U}\).
Use the demonstration function showSVD to experiment with several
\(2{\times}2\) matrices to see the rotation, stretching, and second
rotation. The demonstration starts with a set of points on a circle.
Ultimately, the circle pattern will be changed to show a rotated
ellipse. Figure Fig. 5.4, and figure
Fig. 5.5 show example plots. The plots will be
different for each matrix supplied.
# File: show_SVD.py - A demononstration of how the U, S, and V matrices
#   from SVD rotate, stretch, and rotate vectors making a circle.
#   Try several 2-by-2 matrices to see how each behaves.

import numpy as np
import matplotlib.pyplot as plt
from scipy.linalg import svd

def show_SVD(A: np.array):

    theta = np.linspace(0, 2*np.pi, 30)
    x = np.array([np.cos(theta),np.sin(theta)])
    U,S,Vt= svd(A)
    S = np.diag(S)
    Vx = Vt @ x
    plt.figure()
    plt.axis('equal')
    plt.plot(x[[0],:],x[[1],:],'*')
    plt.scatter(Vx[0,:],Vx[1,:])
    for z in np.arange(30):
        plt.plot(np.array([x[[0],[z]], Vx[[0],[z]]]),
            np.array([x[[1],[z]], Vx[[1],[z]]]), 'k')
    plt.title('Rotation by $V^T$ Matrix')
    svx = S @ Vx
    plt.figure()
    plt.axis('equal')
    plt.scatter(svx[0,:], svx[1,:])
    usvx = U @ svx
    plt.scatter(usvx[0,:],usvx[1,:])
    plt.title('Stretch by $\Sigma$ and rotation by U')

if  __name__ == "__main__":
    show_SVD(3*np.random.rand(2, 2))
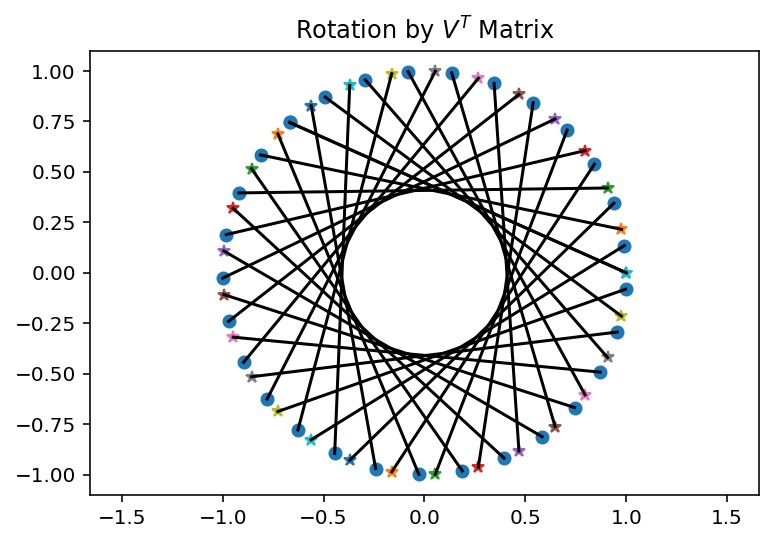
Fig. 5.4 When each point is multiplied by \(\mathbf{V}^T\) the points rotate around the circle. The lines show the initial and final positions of the points.
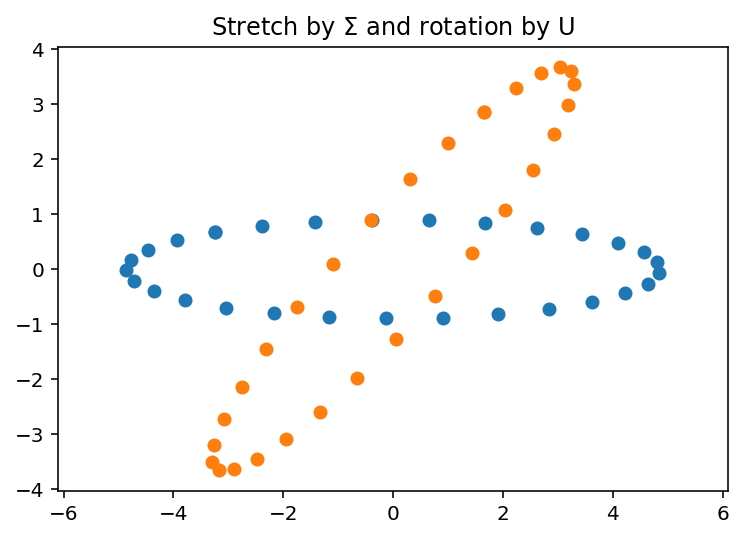
Fig. 5.5 When each point is multiplied by \(\mathbf{\Sigma}\), the points around the circle are moved out from the center to form an ellipse. Then the ellipse is rotated when the points are multiplied by \(\bf{U}\).