11.5. Homework 5 - Mean and Standard Deviation of Numbers
In class, we will discuss how to compute the mean and standard deviation of data samples.
- Mean
The mean of a data set is what we also call the average, or expected value (\(E(X)\)). The mean is the sum of the values divided by the number of values. Outliers (a few values significantly different than the rest of the data) can move the mean. So it can be a poor estimator of the center of the data. The median is less affected by outliers. The symbol for the sample mean of a random variable, \(X\), is \(\bar{x}\). The symbol for a population mean is \(\mu\), which is the expected value, \(E(X)\), of the random variable.
- Standard Deviation
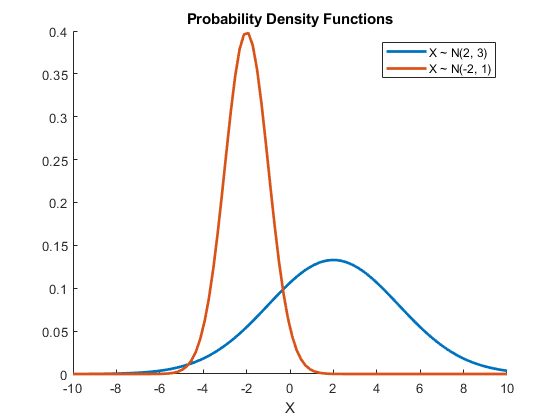
The standard deviation, which is the square root of the variance, is a measure of how widely distributed a random variable is about its mean. As shown in Fig. 11.2, a small standard deviation means that the numbers are close to the mean. A larger standard deviation means that the numbers vary quite a bit. For a normal (Gaussian) distributed variable, 68% of the values are within one standard deviation of the mean, 95% are within two standard deviations and 99.7% are within three standard deviations. The symbol for a sample standard deviation is \(s\) and the symbol for a population standard deviation is \(\sigma\). See Wikipedia site.

Fig. 11.2 Probability Density Functions with \(\sigma = 3\) and \(\sigma = 1\).
We define the difference between a random variable and its mean as \(Y = (X - \bar{x})\). Note that owing to the definition of the mean, \(\bar{y} = 0\). To account equally for the variability of values less than or greater than the mean, we will use \(Y^2\). The maximum likelihood estimator (MLE) of the variance computes the mean value of \(Y^2\).
It is usually preferred to use the unbiased estimator of the variance, which divides the sum by \((n - 1)\) instead of by \(n\). The reason is because \(\sum_{i=1}^n y_i = 0\). So if we know the sum of the first \((n - 1)\) terms, then the last term can be determined. Only \((n - 1)\) of the squared deviations can vary freely. The number \((n - 1)\) is called the degrees of freedom of the variance.
The unbiased variance is then calculated as
The standard deviation, \(s\), is the square root of the variance.
Write a program to read data values from a file and print the mean and standard deviation of the data. Computation of the mean will be worked in class as an example, but you will need to add the computation of the standard deviation to the program.
Here is the example code and the data file used in class:
